
Climate Solutions:
- Who’s Responsible? 100 Years of CO2
- Share

Photo by Andre Kudyusov/Getty Images
Who’s Responsible? 100 Years of CO2
< 1 MIN READ
Feb 9, 2008
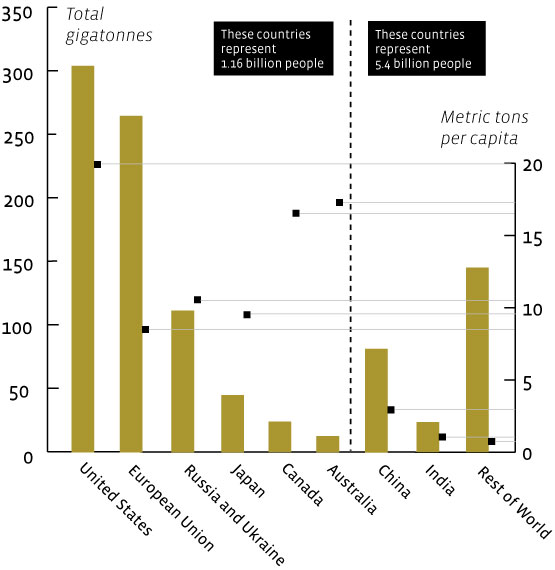
Source: World Resources Institute. YES! Magazine Graphic 2008.
Bars represent total CO2 emissions 1900-2002, by country.
Dots represent per capita CO2 emissions in 2002, by country.
Reprints and reposts: YES! Magazine encourages you to make free use of this article by taking these easy steps.